Figure 1
From: RNA-seq: impact of RNA degradation on transcript quantification

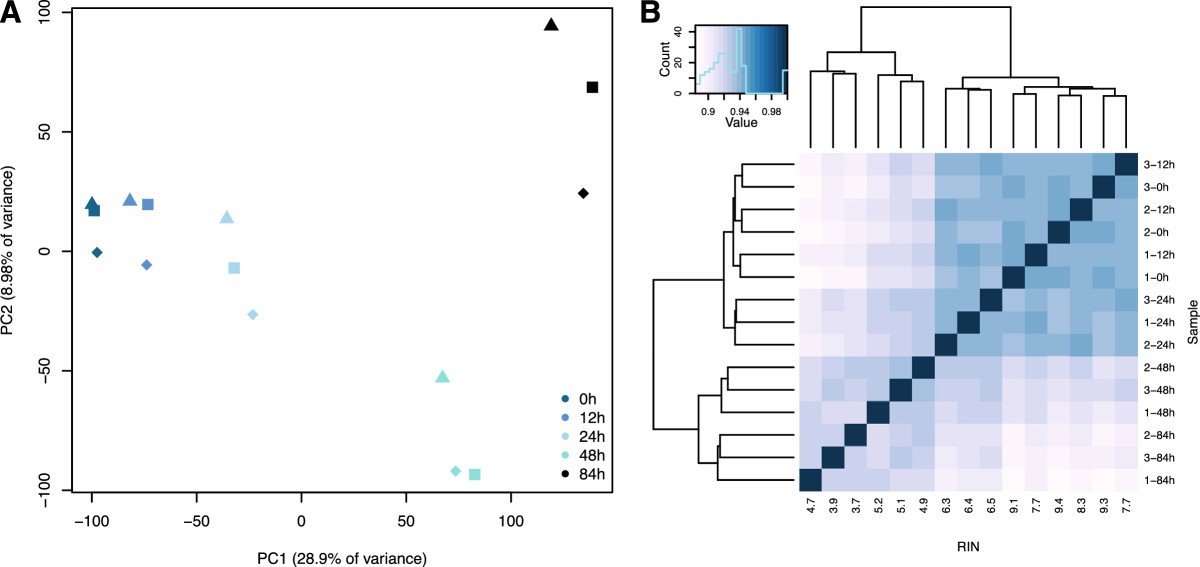
Broad effects of RNA degradation. A) PCA plot of the 15 samples included in the study based on data from 29,156 genes with at least one mapped read in a single individual. Different colors identify different time-points, while each shape indicates a particular individual in the data set. B) Spearman correlation plot of the 15 samples in the study. PCA, principal component analysis.
