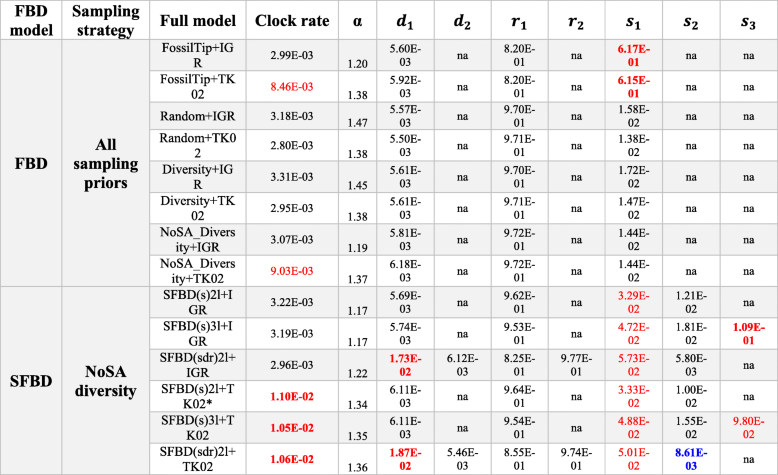
- Results obtained under the FBD (top) and the skyline FBD (SFBD) tree model (bottom) with distinct taxon sampling strategies and relaxed clock models. The SFBD analyses are focused on the optimal sampling strategy (NoSA diversity). Mean values are reported given the very small variance for those parameter estimates (see full descriptive statistics in online Supplementary Information). Estimated means that are higher than modal mean values observed across all strategies with a single partition are highlighted in red, whereas means smaller than modal values are highlighted in blue. Mean values in bold indicate deviations that are an order of magnitude higher or lower than modal values. Abbreviations: α prior on the shape of the gamma parameter for rate variation among characters, d net diversification, r, turnover, s, proportion of fossil sampling, S sampling strategy. For full model explanation, see the “Methods” section. * Preferred model combination for single partition morphological data (see Table 1)
