- WT cells were grown in GDT media and the culture divided. Rapamycin was added to 500 nM for one part and the other was transferred to DB. The analyses used RNA prepared from the growing cell controls, rapamycin cells at 2 h, and DB cells at 30 min, for RNA-seq. Experiments were conducted with 3 independent replicates. Thirteen thousand seven hundred twenty-nine gene numbers were recognized for each analysis
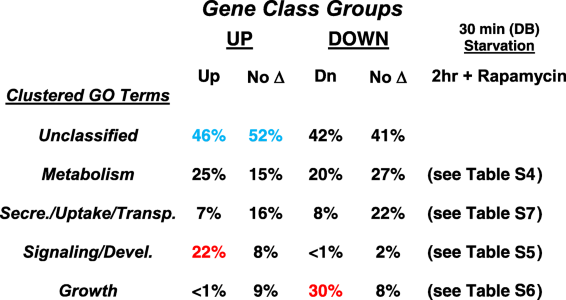
- Genes with significant changes in expression compared to growth were re-grouped between the rapamycin and DB (starved) cultures (see Fig. 5b). Gene sets were analyzed for GO terms. GO terms could be placed into 4 overall clusters. 40 to 50% of the genes in each set could not be classified
- Red colors highlight the strong GO cluster bias of rapamycin-induced (up) genes for signaling (see Fig. 6a) and rapamycin-suppressed (down) genes for growth (see Fig. 6b). Blue colors highlight unclassified genes induced by rapamycin or by starvation alone (see Fig. 5b); genes were randomly selected from each class as a basis for gene function in control of developmental induction (see Fig. 7)
